import imfpWorkflow
imfp


imfp, created and maintained by Promptly Technologies, is a Python package for downloading data from the International Monetary Fund’s RESTful JSON API.
imfp follows the conventions of the econdataverse, a family of open-source packages for working with economic data in R and Python. Its API mirrors the R package imfapi, so the same workflow reads the same way in either language.
ImportantUpgrading from imfp 1.x
Version 2.0.0 replaces imf_databases, imf_parameters, imf_parameter_defs, and imf_dataset with imf_get_dataflows, imf_get_datastructure, imf_get_codelists, and imf_get. The old functions still work but now emit a DeprecationWarning, and will be removed in 3.0.0. See the migration guide.
Installation
To install the stable version of imfp from PyPi, use pip.
pip install --upgrade imfpTo load the library, use import:
Fetching data from the IMF takes four steps, one per function. Each step tells you what to pass to the next.
1. Find a dataset with imf_get_dataflows
The IMF serves hundreds of datasets, called dataflows, and every request has to name one. imf_get_dataflows lists them all:
dataflows = imfp.imf_get_dataflows()
dataflows[["id", "name"]].head()| id | name | |
|---|---|---|
| 0 | SPE_2026_MAY_VINTAGE | Special Purpose Entities (SPEs) 2026 May |
| 1 | FDI | Financial Development Index (FDI) |
| 2 | QNEA | National Economic Accounts (NEA), Quarterly Data |
| 3 | QNEA_2026_MAY_VINTAGE | National Economic Accounts (NEA), Quarterly Da... |
| 4 | GS_ED | Gender Statistics (GS) Education |
We want the Primary Commodity Price System, whose ID is PCPS:
dataflows[dataflows["id"] == "PCPS"][["id", "name", "last_updated"]]| id | name | last_updated | |
|---|---|---|---|
| 65 | PCPS | Primary Commodity Price System (PCPS) | 2025-06-16T17:59:44.643694Z |
See Discovering Datasets for more.
2. Find its dimensions with imf_get_datastructure
Each dataset is filtered on its own set of dimensions, so the next step is to ask which ones PCPS has:
dimensions = imfp.imf_get_datastructure("PCPS")
dimensions| dimension_id | type | position | |
|---|---|---|---|
| 0 | COUNTRY | Dimension | 0 |
| 1 | INDICATOR | Dimension | 1 |
| 2 | DATA_TRANSFORMATION | Dimension | 2 |
| 3 | FREQUENCY | Dimension | 3 |
3. Find valid codes with imf_get_codelists
Dimensions are categorical: each accepts a fixed set of codes. imf_get_codelists returns them as a tidy DataFrame:
codes = imfp.imf_get_codelists(["INDICATOR", "DATA_TRANSFORMATION", "FREQUENCY"], "PCPS")
codes.head()| dimension_id | code | name | description | codelist_id | codelist_agency | codelist_version | |
|---|---|---|---|---|---|---|---|
| 0 | INDICATOR | BARLEY | Barley Mpls Terminal prices, US dollars per bu... | Barley Mpls Terminal prices U$/Bushel Price or... | CL_PCPS_INDICATOR | IMF.RES | 3.0.0 |
| 1 | INDICATOR | LMICS | Low and Middle Income Commodity Index (World B... | World Bank Non-Energy Commodities Price Index ... | CL_PCPS_INDICATOR | IMF.RES | 3.0.0 |
| 2 | INDICATOR | PAGRI | Agriculture, Commodity price index, Index, 201... | Agriculture Price Index, 2016 = 100, includes ... | CL_PCPS_INDICATOR | IMF.RES | 3.0.0 |
| 3 | INDICATOR | PALLFNF | All index, Commodity price index, Index, 2016=100 | All Commodity Price Index, 2016 = 100, include... | CL_PCPS_INDICATOR | IMF.RES | 3.0.0 |
| 4 | INDICATOR | PALLMETA | All Metals Index, Commodity price index, Index... | All Metals Index, 2016 = 100: includes Metal P... | CL_PCPS_INDICATOR | IMF.RES | 3.0.0 |
Because the result is one DataFrame, finding the code you want is an ordinary pandas filter:
# Find the indicator code for coal
codes[
    (codes["dimension_id"] == "INDICATOR")
    & codes["name"].str.contains("Coal index", na=False)
][["code", "name"]]| code | name | |
|---|---|---|
| 14 | PCOAL | Coal index, Commodity price index, Index, 2016... |
# Find the data transformation code for an index
codes[
    (codes["dimension_id"] == "DATA_TRANSFORMATION")
    & codes["name"].str.contains("Index", na=False)
][["code", "name"]]| code | name | |
|---|---|---|
| 136 | INDEX | Index |
| 137 | INDEX_PCH | Index, percent change |
| 138 | INDEX_PCHY | Index, percent change from a year ago |
See Dimensions and Codes for more.
4. Fetch the data with imf_get
Now pass those codes to imf_get. Dimensions you leave out are wildcarded:
df = imfp.imf_get(
    "PCPS",
    dimensions={
        "INDICATOR": ["PCOAL"],
        "DATA_TRANSFORMATION": ["INDEX"],
        "FREQUENCY": ["A"],
    },
)

df.head()| COUNTRY | INDICATOR | DATA_TRANSFORMATION | FREQUENCY | TIME_PERIOD | OBS_VALUE | SCALE | DERIVATION_TYPE | |
|---|---|---|---|---|---|---|---|---|
| 0 | G001 | PCOAL | INDEX | A | 1992 | 49.892138 | 0 | R |
| 1 | G001 | PCOAL | INDEX | A | 1993 | 43.279151 | 0 | R |
| 2 | G001 | PCOAL | INDEX | A | 1994 | 45.213931 | 0 | R |
| 3 | G001 | PCOAL | INDEX | A | 1995 | 55.433711 | 0 | R |
| 4 | G001 | PCOAL | INDEX | A | 1996 | 53.179458 | 0 | R |
Dimensions can also be passed as keyword arguments, which is terser for short queries:
df = imfp.imf_get("PCPS", indicator="PCOAL", data_transformation="INDEX", frequency="A")See Fetching Data for more.
Working with the Returned Data Frame
imf_get returns tidy data: one observation per row, one variable per column. OBS_VALUE is already numeric, but TIME_PERIOD is a string, because its format depends on the frequency of the series (“2000” for annual data, “2000-Q1” for quarterly, “2000-M01” for monthly). For an annual series it converts directly:
df = df.astype({"TIME_PERIOD": int})Then, using seaborn with hue, we can plot different indicators in different colors:
import seaborn as sns

# Plot prices of different commodities in different colors with seaborn
sns.lineplot(data=df, x="TIME_PERIOD", y="OBS_VALUE", hue="INDICATOR");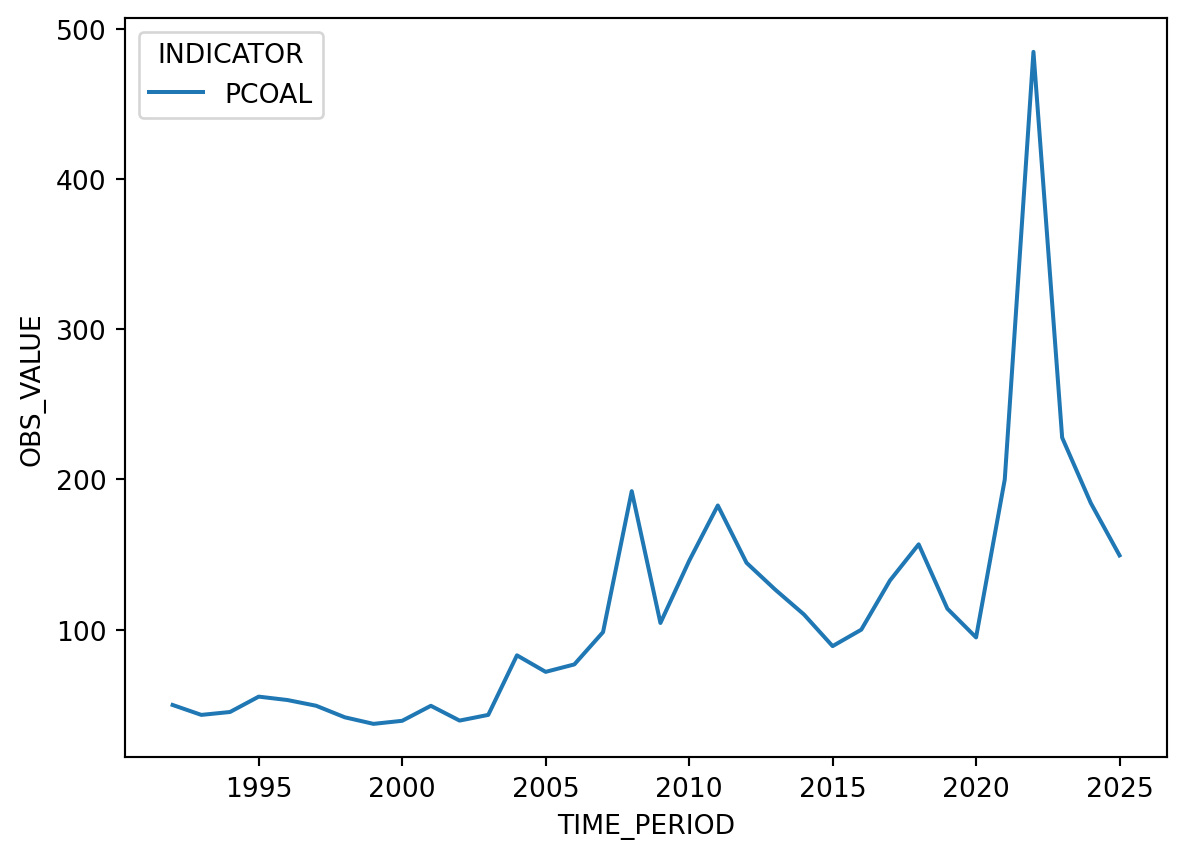
Contributing
We welcome contributions to improve imfp! Here’s how you can help:
- If you find a bug, please open a Github issue
- To fix a bug:
- Fork and clone the repository and open a terminal in the repository directory
- Install uv with
curl -LsSf https://astral.sh/uv/install.sh | sh - Install the dependencies with
uv sync - Install a git hook to enforce conventional commits with
curl -o- https://raw.githubusercontent.com/tapsellorg/conventional-commits-git-hook/master/scripts/install.sh | sh - Create a fix, commit it with an “Angular-style Conventional Commit” message, and push it to your fork
- Open a pull request to our
mainbranch
Note that if you want to change and preview the documentation, you will need to install the Quarto CLI tool and run uv run great-docs build (or uv run great-docs preview).
Version incrementing, package building, testing, changelog generation, documentation rendering, publishing to PyPI, and Github release creation is handled automatically by the GitHub Actions workflow based on the commit messages.